Mini Course

A hands-on mini course on multimodal large language models and their clinical applications

From architecture to fine-tuning, inference, and evaluation with MedGemma 1.5.

1Faculty of Applied Science and Engineering, University of Toronto  ·  2Princess Margaret Cancer Centre & AI Hub, University Health Network

About this mini course

Multimodal LLMs combine images, text, video, and audio in a single model - and they are rapidly becoming practical tools in clinical workflows. This mini course walks through the complete pipeline for a medical image-text-to-text task: understanding how MLLMs align modalities, dissecting the MedGemma 1.5 architecture, then preparing the FLARE-MLLM-2D dataset, fine-tuning with QLoRA, running inference, and evaluating report generation with CRIMSON and GREEN scores.

Every hands-on step runs in an interactive Jupyter notebook on Colab, and everything is mirrored in the course repository on GitHub.

≈ 90 minutes end to end ≈ 35 minutes of notebook runtime 8 modules Level: graduate (MSc / PhD) Format: self-paced, Colab notebook

Learning objectives

By the end of this mini course you should be able to:

  1. Explain why modality alignment is the central problem in multimodal LLMs, and contrast the four architectural families that solve it - LLaVA, BLIP-2, Flamingo, and Kosmos.Module 01
  2. Trace how MedGemma 1.5 turns a medical image into visual tokens a language model can read, naming the role of MedSigLIP, the multimodal projector, and the Gemma 3 decoder.Module 02
  3. Convert a raw medical imaging dataset into Hugging Face supervised fine-tuning format, and describe the preprocessing choices that shape what the model learns.Module 03
  4. Fine-tune a 4B vision-language model with QLoRA on a single GPU, and explain what low-rank adapters and 4-bit quantization each contribute.Module 04
  5. Run inference with the base and fine-tuned checkpoints and compare their generated reports side by side.Module 05
  6. Evaluate generated reports with CRIMSON and GREEN, compute both by hand on a worked example, and articulate what each score does and does not capture.Module 06

Prerequisites

What you should know

  • Comfortable reading and running Python in a notebook
  • Basic PyTorch: tensors, a training loop, moving work to a GPU
  • Deep learning fundamentals - what attention is, what fine-tuning does
  • Helpful but not required: prior exposure to Hugging Face transformers
  • No radiology background is assumed. Clinical concepts are introduced where they matter

What you need to have

  • A Google account for Colab, or a local Jupyter environment
  • A Hugging Face account, plus accepted data terms for FLARE-MLLM-2D and access to the MedGemma weights
  • A GPU runtime with ≥ 40 GB VRAM (A100 or H100 class). The free Colab T4 has 16 GB and will run out of memory during fine-tuning
  • Roughly 15 GB of free disk for the dataset and checkpoints

Course outline

01 BackgroundIntroduction to MLLM + clinical applications Jump →
02 Model ArchitectureDetailed description of the MedGemma 1.5 model architecture Jump →
03 Data PreparationPrepare the FLARE-MLLM-2D dataset for fine-tuning Jump →
04 Fine-tuningFine-tune MedGemma 1.5 4B on the preprocessed dataset Jump →
05 InferenceInfer with the base and fine-tuned MedGemma 1.5 4B Jump →
06 EvaluationEvaluate MedGemma 1.5 4B’s performance on report generation using CRIMSON score and GREEN score Jump →
07 ConclusionSummary of what we have covered in the mini course Jump →
08 QuizTest your knowledge with the provided NotebookLM Jump →

Module 01

Background

Introduction to MLLM + clinical applications.

Introduction to MLLM

MLLM emphasizes the alignment of latent spaces between different modalities. The building blocks are familiar - an image encoder and a text decoder - and the interesting question is how to combine encoders and decoders of different modalities so they can operate as one model.

Based on the input and output modalities, we can classify MLLMs into categories like the ones on the right. Hugging Face also uses these categories.

MLLM task categories

  • Audio-text-to-text
  • Image-text-to-text
  • Image-text-to-image
  • Image-text-to-video
  • Video-text-to-text
  • Any-to-any

The catch is that a vision encoder and a language model are normally pretrained separately, on different data and different objectives. Each learns its own latent space, and because optimization is stochastic there is no reason the two coordinate systems agree - a patch embedding from the vision tower means nothing to a language model that never saw it during training. (Contrast this with a jointly trained encoder–decoder such as a UNet, where both halves are optimized together and therefore share a latent space by construction.) Bridging two independently pretrained towers is precisely the alignment problem, and there are several approaches, shown below.

LLaVA-style

Align vision features to an existing LLM

+Simple projector, cheap to train, reuses a full off-the-shelf LLM
-Every visual token sits in the input sequence, so long/many images inflate context length

BLIP-2-style

Compress vision through learned queries

+Fixed, small number of visual tokens regardless of image size or resolution
-Extra Q-Former to train, and compression can lose fine-grained visual detail

Flamingo-style

Inject vision through cross-attention

+Handles many interleaved images/video without growing the text sequence
-Requires splicing new cross-attention layers into the LLM, more invasive and harder to adapt with lightweight fine-tuning

Kosmos-style

Train a unified multimodal autoregressive model
+One shared representation space by design, flexible across input/output modalities
-Most data- and compute-hungry option, can't just bolt onto an existing pretrained LLM
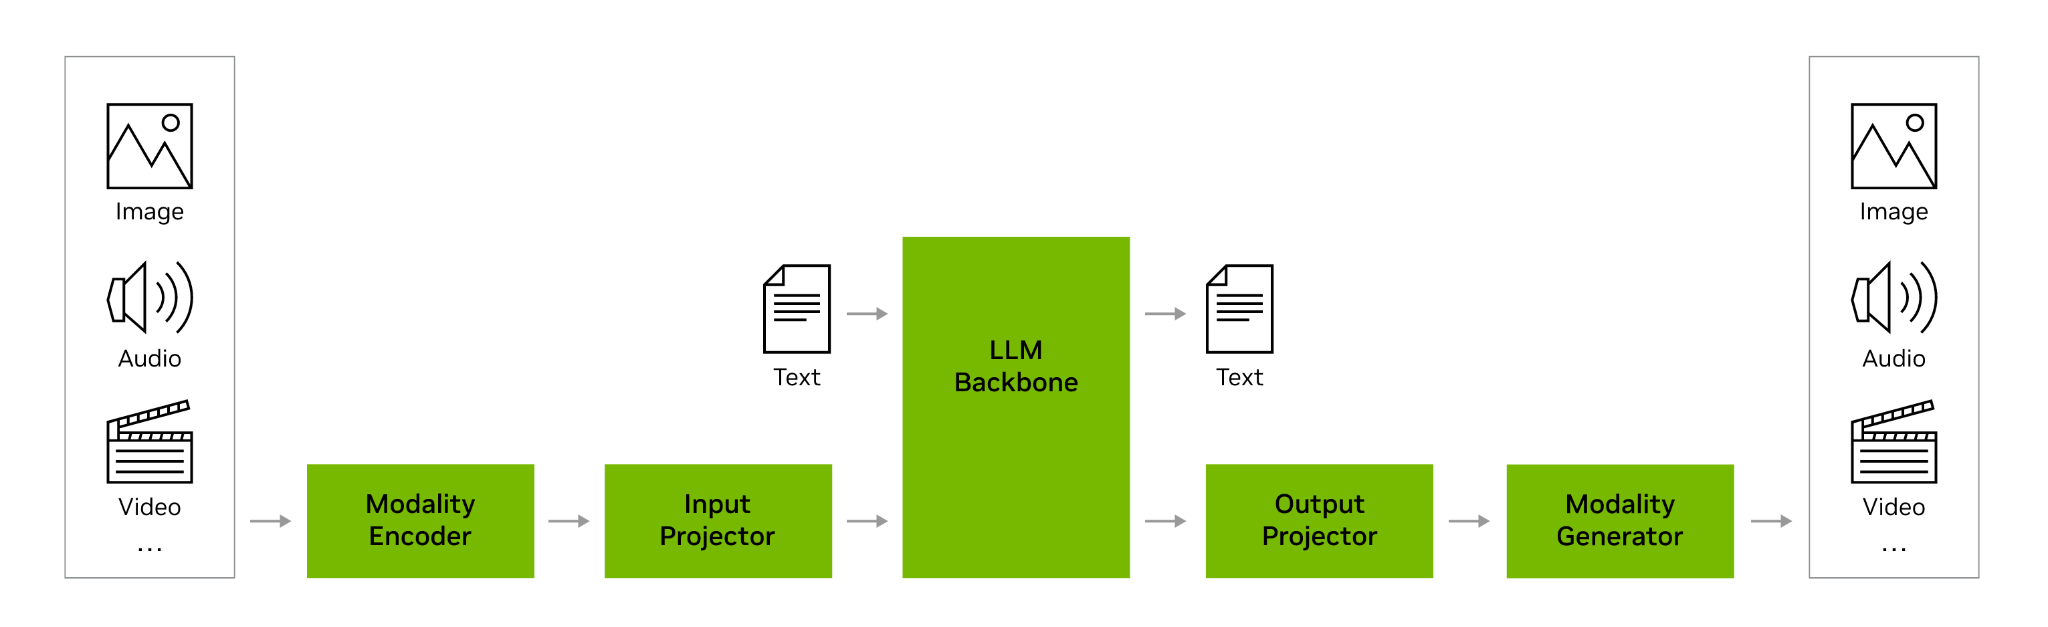
General MLLM architecture: modality encoder, input projector, LLM backbone, output projector, modality generator
The general anatomy of an MLLM: modality encoders project non-text inputs into the LLM backbone; projectors and generators map latents back out to other modalities.

Figure credit: NVIDIA. (n.d.). Multimodal large language models. NVIDIA Glossary. Retrieved from nvidia.com/en-us/glossary/multimodal-large-language-models  ·  Extended reading: Multimodal Large Language Models - NVIDIA

Clinical applications of MLLMs

MLLMs are powerful in a clinical workflow for perception, reasoning, documentation, triage, and patient-facing support.

Below are five concrete clinical applications (CAs), each illustrating one way an MLLM slots into practice.

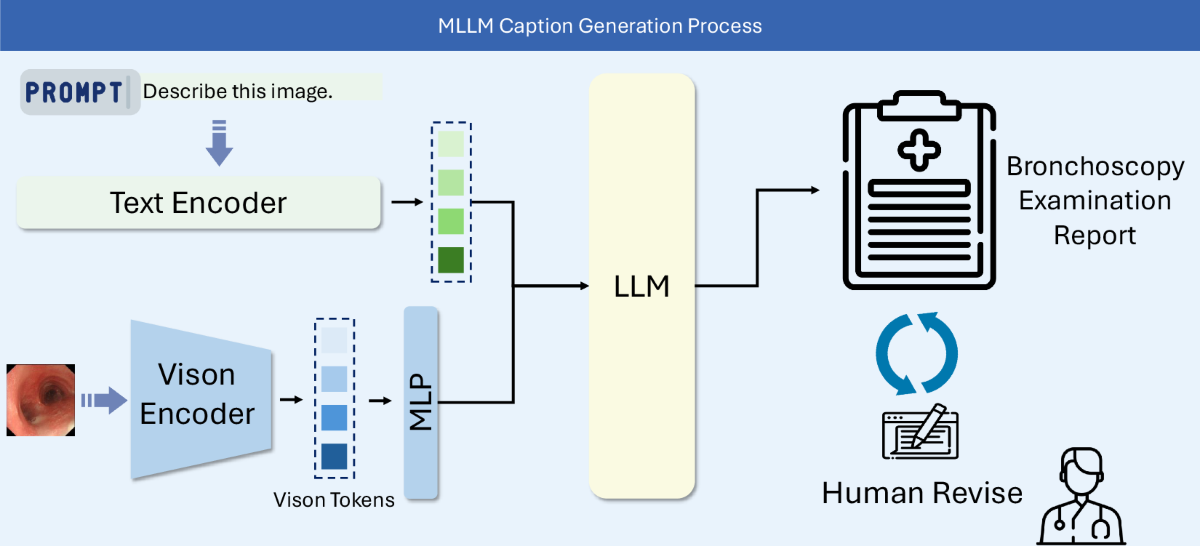
CA1Report generation

In a report generation task, the MLLM:

MLLM caption generation process producing a bronchoscopy examination report with human revision

Figure credit: Luo, X., Huang, X., Liang, X. et al. Towards Automated Reporting: A Bronchoscopy Report Dataset for Enhancing Multimodality Large Language Models. Sci Data 13, 339 (2026). doi.org/10.1038/s41597-026-06692-8

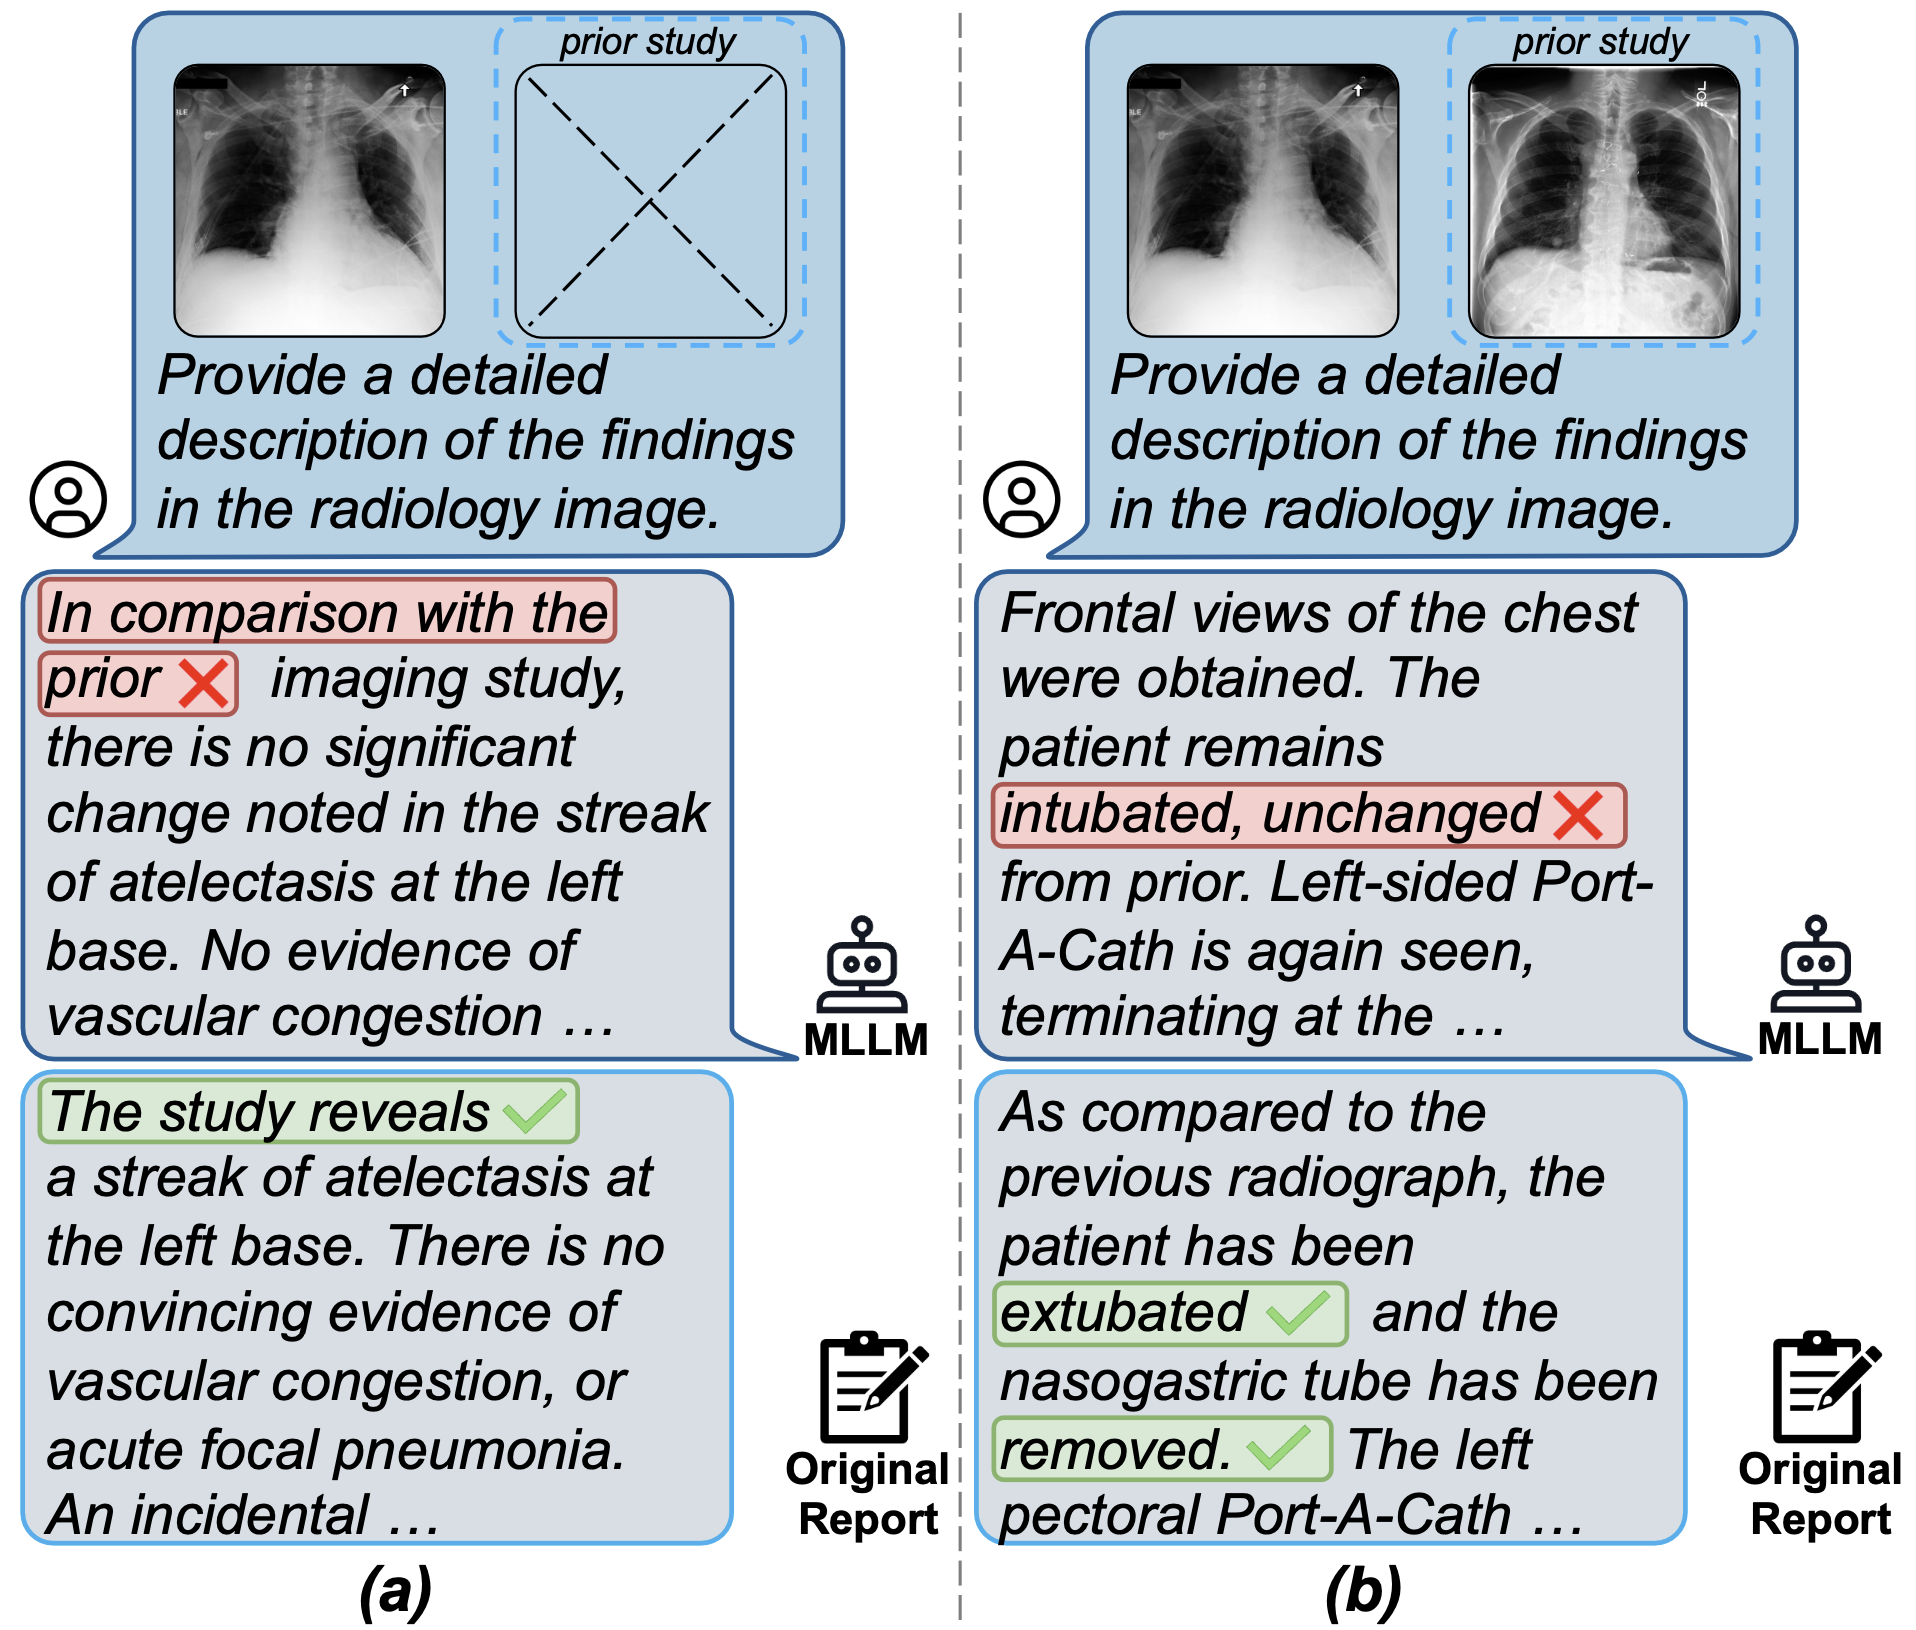
CA2Longitudinal comparison

In a longitudinal comparison task, the MLLM:

Comparison of MLLM radiology answers with and without a prior study

Figure credit: Zhang, X., Meng, Z., Lever, J., & Ho, E. S. (2025, July). Libra: Leveraging temporal images for biomedical radiology analysis. In Findings of the Association for Computational Linguistics: ACL 2025 (pp. 17275–17303). doi.org/10.48550/arXiv.2411.19378

CA3Multi-class classification

In a multi-class classification task, the MLLM outputs one label for several classes. It is the same as naive classification, but with outputs in the form of text - we use string parsers to convert the textual class ids into integers. Some common clinical examples are BI-RADS category, tumor subtype, disease stage, and dermatology diagnosis category.

Photo of a tabby cat
Vision Encoder
“What animal is shown in the image? Answer in a single {class id} only: 0 for cat, 1 for dog, and 2 for owl.”
Tokenizer+ embedding
LLM
0

Figure credit: Wikipedia - Cat (Cat_August_2010-4.jpg)

CA4Multi-label classification

In a multi-label classification task, the MLLM outputs multiple labels at once. Common clinical examples include chest X-ray findings: edema, consolidation, atelectasis, cardiomegaly, and pleural effusion.
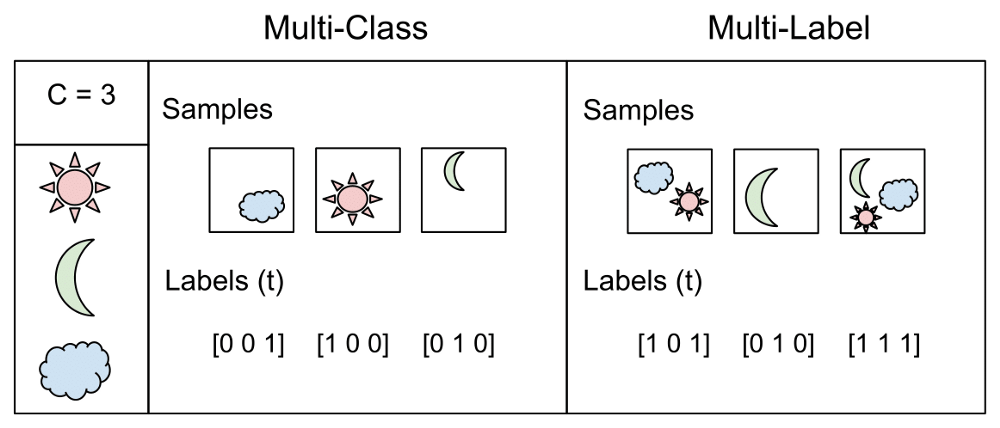
Multi-class versus multi-label classification examples with one-hot and multi-hot label vectors

Figure credit: Sharma, G. (2021, February 7). Multi-label classification. Medium; Analytics Vidhya. medium.com/analytics-vidhya/multi-label-classification

CA5Regression

In a regression task, the MLLM outputs a continuous value. It is the same as naive regression, but with outputs in the form of text - we use string parsers to convert the strings into floats. Some common clinical examples are ejection fraction, tumor size, organ volume, lab value prediction, risk score, and survival time.

Photo of a tabby cat
Vision Encoder
“What percentage of the image area does the cat occupy?”
Tokenizer+ embedding
LLM
0.43

Figure credit: Wikipedia - Cat (Cat_August_2010-4.jpg)

Course setup

In this mini course, we are going to use MedGemma 1.5 4B as an example. The MedGemma family consists of LLaVA-style vision-language models (VLMs) designed for image-text-to-text tasks, specialized in medical images.

Throughout the mini course, we will be learning hands-on examples with MedGemma 1.5, covering a complete pipeline for the report generation task using the FLARE-MLLM-2D dataset.

The hands-on pipeline

  • Data preparation
  • Fine-tuning
  • Inference
  • Evaluation

Dataset: FLARE-MLLM-2D · Model: MedGemma 1.5 4B
Module 02

Model architecture

Detailed description of the MedGemma 1.5 model architecture.

MedGemma overview

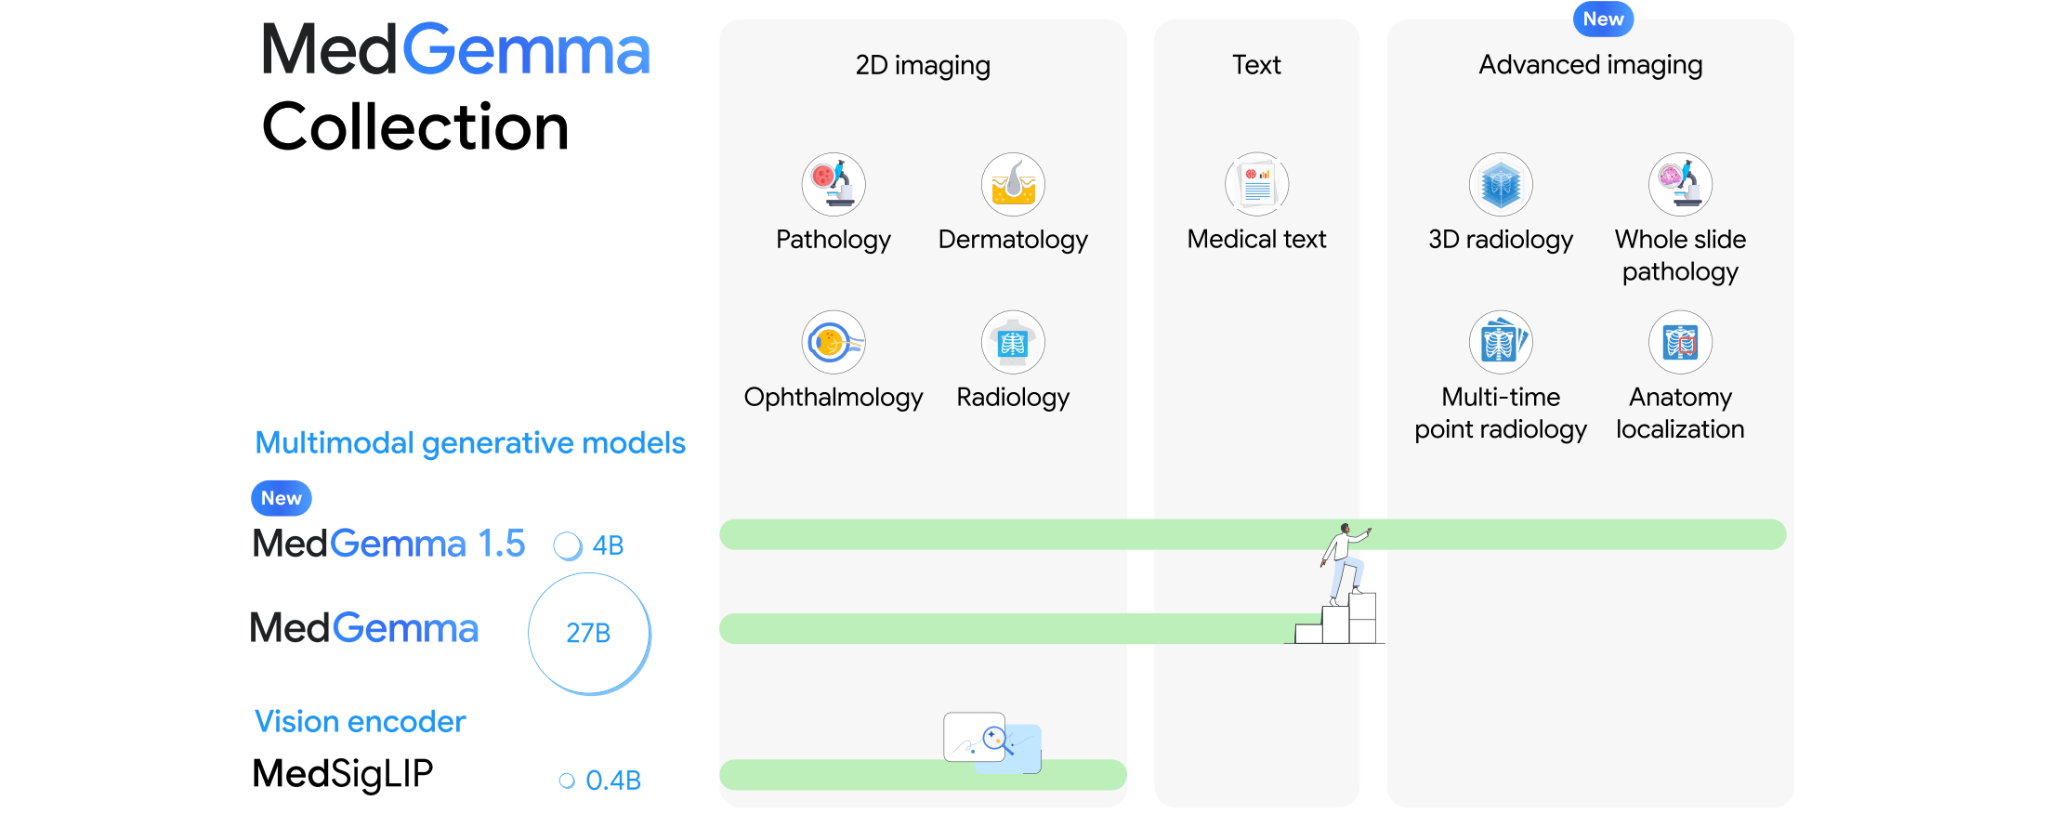
MedGemma collection: MedGemma 1.5 4B, MedGemma 27B, and the MedSigLIP vision encoder across 2D imaging, text, and advanced imaging

Figure credit: Sellergren, A., Gao, C., Mahvar, F., Kohlberger, T., Jamil, F., Traverse, M., ... & Golden, D. (2026). MedGemma 1.5 technical report. arXiv preprint arXiv:2604.05081. doi.org/10.48550/arXiv.2604.05081

MedGemma 1.5

3D CT Scan
2D Slices
MedSigLIPEncoder
Gemma 3Decoder
Text Outputs

Inside MedSigLIPEncoder-only Vision Transformer (ViT) · SigLIP-400M tuned on medical data

896×896 imageresized to the encoder’s fixed input resolution
Patch embedding14×14 pixel patches → 64×64 = 4,096 patch tokens + position embeddings
× 27 blocks
Bidirectional self-attention16 heads · width 1,152 · every patch attends to every patch - no causal mask
MLPGELU · hidden 4,304 · LayerNorm around each sub-layer
Average pooling4,096 patch tokens → 256 visual tokens
Multimodal projectornorm + linear map into Gemma 3’s 2,560-d embedding space
256 visual tokens per image“pan & scan” may add extra crops, each encoded the same way

MedSigLIP is the 400M-parameter SigLIP image encoder further trained on medical image–text pairs with SigLIP’s sigmoid contrastive loss, so its visual features are aligned with medical language before the LLM ever sees them.

Inside Gemma 3 (4B)Decoder-only Transformer LLM · generates text autoregressively

Input sequencetext tokens (262K SentencePiece vocab) with visual tokens spliced in at each image position
Token embeddingsdmodel = 2,560 · shared with the output layer
× 34 blocks
Grouped-query attention + RoPE8 query heads share 4 KV heads · head dim 256 · RMSNorm before & after
GeGLU feed-forwardhidden dimension 10,240

5 local sliding-window attention layers (1,024-token window) for every 1 global layer → a 128K-token context at manageable KV-cache cost

Final RMSNorm + LM headprobability distribution over the 262K vocabulary
Next tokenappended to the sequence and fed back in until the report is complete

Attention is causal over text - each token sees only its past - but all visual tokens belonging to the same image attend to each other bidirectionally.

MedGemma 1.5 4B is based on Gemma 3 with the same general architecture, using a 400M MedSigLIP vision encoder as the visual front end and a decoder-only Transformer LLM as the text generator. Images are normalized to 896×896 and encoded into 256 visual tokens per image.

The key improvement between MedGemma 1 and MedGemma 1.5 is the long context window, with which we are able to feed multiple uniformly sampled slices (up to 85, modeled as a time sequence) to represent a 3D volume. However, in this mini course, we only deal with 2D images.

The encoder runs at a fixed 896×896 input and pools its 4,096 patch tokens down to 256 visual tokens. For images that are large or far from square, an optional “pan & scan” pass crops additional windows and encodes each one the same way, trading extra tokens for effective resolution.

Cited: Sellergren, A., Gao, C., Mahvar, F., Kohlberger, T., Jamil, F., Traverse, M., ... & Golden, D. (2026). MedGemma 1.5 technical report. arXiv preprint arXiv:2604.05081. doi.org/10.48550/arXiv.2604.05081

Module 03

Data preparation

Prepare the FLARE-MLLM-2D dataset for fine-tuning.

1

Download FLARE-MLLM-2D ≈ 2 minutes

The FLARE-MLLM-2D dataset is a multimodal dataset for the MICCAI FLARE challenge. It can be downloaded (with permissions) through Hugging Face.

2

Preprocess ≈ 5 minutes

Since we use Hugging Face’s transformers as the backend of the pipeline, we want to convert the dataset format into Hugging Face’s supervised fine-tuning (SFT) records’ format.

Try it out yourself!

Please find the interactive Jupyter Notebook attached on Colab. You can also find everything in the course repository on GitHub.

Module 04

Fine-tuning

Fine-tune MedGemma 1.5 4B on the preprocessed dataset.

Fine-tuning protocols

Even with foundation models trained on massive amounts of data, it is still extremely common that the application dataset is out of distribution (OoD). To adapt to the target domain, we need to apply fine-tuning. There are multiple ways to perform fine-tuning; in this mini course, we will focus on parameter-efficient fine-tuning (PEFT) - specifically QLoRA.

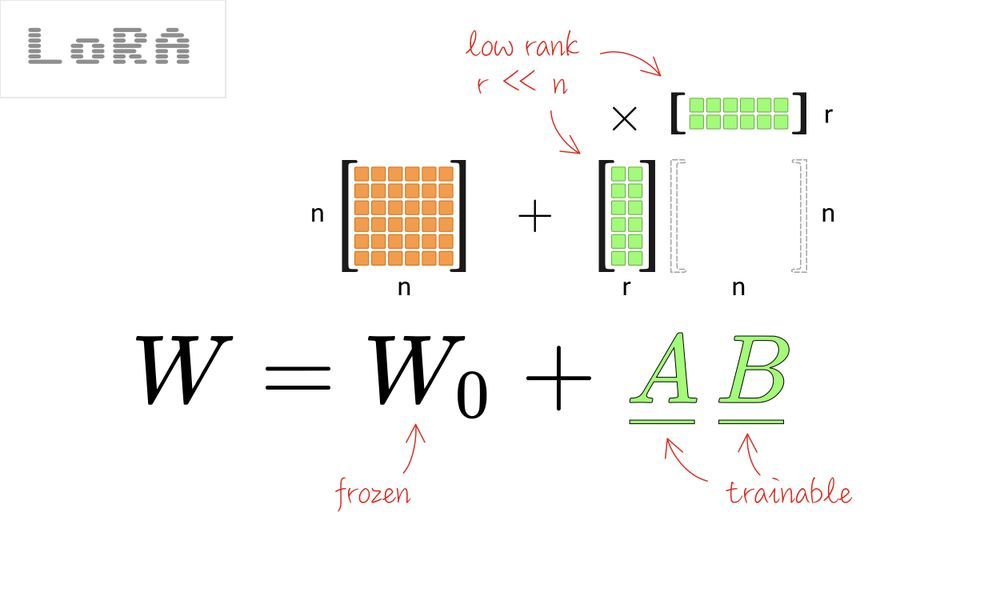
LoRA: frozen weight matrix W0 plus trainable low-rank matrices A and B
LoRA keeps W₀ frozen and learns a low-rank update AB; QLoRA applies the same adapters on top of 4-bit quantized base weights.

Figure credit: Görner, M. (2025, March 13). Are you still using LoRA to fine-tune your LLM? Towards Data Science. towardsdatascience.com/are-you-still-using-lora-to-fine-tune-your-llm

3

Run fine-tuning ≈ 15 minutes, depending on GPU

In this mini course, we will fine-tune for only 0.25 epochs to save time.

Try it out yourself!

Please find the interactive Jupyter Notebook attached on Colab. You would need a GPU runtime with ≥ 40 GB VRAM (A100 or H100 class) - see Prerequisites for the full setup. Everything is also in the course repository on GitHub.

Module 05

Inference

Infer with the base and fine-tuned MedGemma 1.5 4B.

4

Run inference ≈ 5 minutes, depending on GPU

Now let us infer on 16 samples (to save time) in the validation set, with both the base and the fine-tuned model.

Try it out yourself!

Please find the interactive Jupyter Notebook attached on Colab. You would need a GPU runtime with ≥ 40 GB VRAM (A100 or H100 class) - see Prerequisites for the full setup. Everything is also in the course repository on GitHub.

Module 06

Evaluation

Evaluate MedGemma 1.5 4B’s performance on report generation using CRIMSON score and GREEN score.

Evaluation metrics

CRIMSON Score

  • Scope. Chest X-ray reports. GPT-5.2 is the judge backbone; a fine-tuned MedGemma is also released so the metric can run locally without sending reports to an external API.
  • Stage 1 - extract and weight. Pull every abnormal finding from both reports (normal findings are excluded, so reporting style cannot inflate the score), then assign each finding a clinical significance weight w(f) from a rubric written with attending cardiothoracic radiologists. Patient age and indication feed this call: aortic calcification is expected/benign at 75, actionable at 25.
  • Stage 2 - classify. Discrepancies fall into false findings (hallucinations), missing findings (omissions), and attribute errors on matched findings across eight dimensions: location/laterality, severity/extent, morphology, measurement, certainty, under-interpretation, over-interpretation, and temporal comparison. Each attribute error is weighted 0.5 if significant, 0.0 if negligible - wrong laterality is significant, “apical” vs “lateral” in one lobe is not.
  • Stage 3 - score. Severity-weighted credit minus weighted false positives, normalized by the reference report’s total significance. Range is (-1, 1]: 1 is perfect, 0 means no more useful than submitting a normal template, and negative means a radiologist would rather start from a blank template than edit this report.
  • Validation. Against clinically significant error counts from six board-certified radiologists on ReXVal: Kendall’s τ = 0.61-0.71, Pearson’s r = 0.71-0.84. Also released with two new benchmarks, RadJudge and RadPref.

Cited: Baharoon, M., Heintz, T., Raissi, S., Alabbad, M., Alhammad, M., AlOmaish, H., Kim, S. E., Banerjee, O., & Rajpurkar, P. (2026). CRIMSON: A clinically-grounded LLM-based metric for generative radiology report evaluation. arXiv preprint arXiv:2603.06183. doi.org/10.48550/arXiv.2603.06183

GREEN Score

  • Scope. Radiology reports broadly. The judge is an open-source LM under 7B parameters, fine-tuned on ~100k reference/candidate report pairs drawn from six chest X-ray corpora (MIMIC-CXR, MIMIC-PRO, CandidPTX, PadChest, BIMCV-COVID19, OpenI).
  • Step 1 - generate the error notation. The judge reads both reports and emits structured text: a list of matched findings plus counts for six error categories - (a) false report of a finding, (b) missing a finding, (c) wrong anatomic location, (d) wrong severity, (e) mentioning a comparison absent from the reference, (f) omitting a comparison to a prior study. Each error is also tagged significant or insignificant.
  • Step 2 - parse. Counts are pulled out of that text with regular expressions (parse_error_counts in the green-score package); per-category counts and matched-finding counts land in a result dataframe.
  • Step 3 - score. Matched findings over matched findings plus significant errors, giving a value in [0, 1]. Insignificant errors are reported but kept out of the score. Because matched findings sit in both numerator and denominator, concise and accurate reports are the hardest to score well.
  • Validation. On ReXVal, GREEN’s significant-error count lands within 1.54 of the average radiologist’s - close to inter-expert disagreement - and it returns a natural-language explanation naming each error, so it doubles as model feedback.

Cited: Ostmeier, S., Xu, J., Chen, Z., Varma, M., Blankemeier, L., Bluethgen, C., Michalson, A. E., Moseley, M., Langlotz, C., Chaudhari, A. S., & Delbrouck, J.-B. (2024). GREEN: Generative radiology report evaluation and error notation. In Findings of the Association for Computational Linguistics: EMNLP 2024 (pp. 374–390). Association for Computational Linguistics. doi.org/10.18653/v1/2024.findings-emnlp.21

One case, two candidate reports

CONTEXT: 78-year-old, dyspnea.
REFERENCE: Moderate left pleural effusion. Aortic atherosclerosis.

Clinically correct, reworded

There is a moderate effusion in the left pleural space. Atherosclerotic aorta.

Shares few exact n-grams with the reference, so BLEU and ROUGE-L rank this report lower than the one on the right.

GREEN

  • Matched findings: 2 (effusion, atherosclerosis)
  • Significant errors: 0

2 / (2 + 0)1.00

CRIMSON

  • Effusion · actionable, not urgent · w = 0.5 · matched, no attribute errors → credit 0.5
  • Atherosclerosis at 78 · expected/benign · w = 0 · contributes nothing either way
  • False findings: none, so Efalse = 0

(0.5 − 0) / Wref = 0.5 / 0.51.00

Clinically wrong, near-verbatim

No left pleural effusion. Aortic atherosclerosis.

Reuses the reference’s exact wording, so surface metrics score it higher - a one-word negation that inverts the diagnosis barely moves them.

GREEN

  • Matched findings: 1 (atherosclerosis)
  • Category (b), missing a finding present in the reference: the effusion → 1 significant error

1 / (1 + 1)0.50

CRIMSON

  • Effusion · w = 0.5 · missing, so it earns no credit
  • Atherosclerosis · w = 0 · matched, but worth nothing at this age
  • False findings: none, so Efalse = 0

(0 − 0) / 0.50.00

How GREEN aggregates
range [0, 1] · 0 if nothing matched
GREEN = matched findingsmatched findings + Σ significant errors

Errors come from six categories: false finding, missing finding, wrong location, wrong severity, a comparison absent from the reference, and an omitted prior-study comparison. The judge tags each one significant or insignificant, and only significant errors reach the denominator.

How CRIMSON aggregates
range (-1, 1] · 0 = normal-template baseline

Every abnormal finding carries a rubric weight w, set with the patient’s age and indication in view:

1.00 urgent 0.50 actionable 0.25 not actionable 0.00 expected/benign
C = Σmatched i wi · wiwi + Eattr,i

C is the credit the candidate earns. Each matched finding contributes its own weight wi, scaled by a partial-credit factor that equals 1 when every attribute is right and shrinks as significant attribute errors (0.5 each) accumulate. Because wi sits in both numerator and denominator, one attribute error costs proportionally less on an urgent finding than on a minor one.

S = CEfalseWref

S is the raw score: net credit, C minus the weight of hallucinated findings Efalse, over Wref - the total significance available in the reference. Missing findings are penalized implicitly: they count toward Wref but earn no credit. Below zero the score is squashed by −A/(1+A), A = EfalseC, so it approaches -1 asymptotically however many false findings pile up.

Why n-gram overlap fails and what replaces it. A one-word negation flips the diagnosis while preserving almost every n-gram, so BLEU and ROUGE-L prefer the wrong report; both LLM-based metrics reason over findings instead and separate the two. They then part ways on aggregation: GREEN counts significant errors against matched findings, whereas CRIMSON weights each finding by clinical consequence - giving the failed report 0.00, its “no better than a normal template” baseline, rather than the 0.50 that counting alone yields.
5

Run evaluation ≈ 5 minutes, depending on GPU

Let us evaluate the inference outputs using CRIMSON score and GREEN score.

Expected results

The evaluation cell prints a per-sample table and a mean CRIMSON and GREEN score for both the base and the fine-tuned checkpoint, so you can compare them directly. Here is what to look for when your run finishes:

  • A visible change in report style. This is the clearest effect of even a quarter epoch. The base model tends to produce long, hedged, general-purpose descriptions; the fine-tuned model produces shorter reports that imitate the terse structure of the FLARE reference reports.
  • Low absolute scores for both models. Both metrics are demanding - they reward correct findings and penalize hallucinated ones, so scores far below 1 are normal and not a sign that something went wrong.
  • CRIMSON can go negative where GREEN cannot. If a model invents findings that are not in the reference, weighted false positives can exceed earned credit, which is exactly what a score below zero is meant to signal.
  • The two metrics need not agree. A report that misses one benign finding barely moves CRIMSON but still costs GREEN a matched finding. Disagreement is informative, not a bug.

Do not read these numbers as a benchmark result. This run fine-tunes for 0.25 epochs and evaluates on 16 validation samples, both chosen so the notebook finishes in minutes. At that scale the difference between the base and fine-tuned means is well within noise, and a re-run can reverse the ordering - CRIMSON’s default GPT-5.2 backbone is itself non-deterministic, which is why the paper averages five runs. Treat the output as a demonstration that the pipeline is wired correctly end to end. For a result worth reporting, train at least one full epoch and evaluate the entire validation split.

Try it out yourself!

Please find the interactive Jupyter Notebook attached on Colab. You would need a GPU runtime with ≥ 40 GB VRAM (A100 or H100 class) - see Prerequisites for the full setup. Everything is also in the course repository on GitHub.

Module 07

Key takeaways

  1. MLLMs combine multiple modalities such as images and text; the core challenge is modality alignment, since vision encoders and language models do not naturally share the same latent representation space.
  2. Different architectures solve alignment differently - LLaVA-style projection, BLIP-2 learned queries, Flamingo-style cross-attention, and Kosmos-style unified modeling - enabling clinical tasks from report generation and longitudinal comparison to classification and regression.
  3. The course’s main example, MedGemma 1.5 4B, is a LLaVA-style model that pairs a MedSigLIP vision encoder with a Gemma 3 decoder, turning medical images into visual tokens the LLM uses to generate text.
  4. The hands-on workflow uses the FLARE-MLLM-2D dataset, downloaded, preprocessed, and converted into Hugging Face supervised fine-tuning format.
  5. Fine-tuning uses QLoRA - training small low-rank adapters on 4-bit weights - and results are evaluated with CRIMSON and GREEN scores that check radiology reports for clinical errors, missing findings, and severity-weighted mistakes.

Module 08

Quiz

Test your learning outcomes

A NotebookLM has been prepared with the course materials - quiz yourself on everything covered in this mini course.

Open the NotebookLM Quiz

Instructors

Tianhao (Terry) Fu

Faculty of Applied Science and Engineering, University of Toronto · Princess Margaret Cancer Centre & AI Hub, University Health Network

Jun Ma

Princess Margaret Cancer Centre & AI Hub, University Health Network